The output for Sanger sequencing is typically a chromatogram, also known as a trace or ab1 file, and a text-based sequence file. Although the latter may seem to hold all the relevant information—after all, the point of sequencing is to get a sequence—the former can't be ignored. The chromatogram contains valuable data that speaks to the accuracy of the generated sequence. The base-calling software does its best to interpret the chromatogram, but it's not always accurate, especially with poor-quality data. Thus, it's important to visually inspect all your traces to ensure that the output sequence represents reality. Here, we provide a guide to understanding Sanger sequencing data, covering the following topics:
Chromatogram Features
A chromatogram represents the migration of labeled sequencing products via capillary electrophoresis. Fluorescence is detected at the end of the capillary, and signal intensity from four color channels, each representing a DNA base, is plotted on the y-axis relative to time on the x-axis.
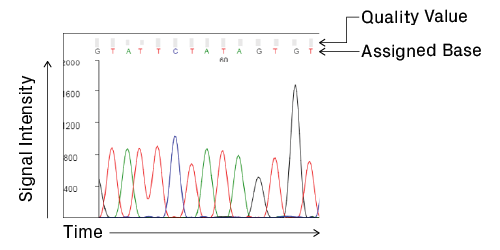
Anatomy of a chromatogram. Signal intensity, in relative fluorescence units, is plotted over time, which correlates with base position. Analysis software processes the raw data and assigns bases to the peaks to generate the final trace and sequence. Quality values are calculated for each assigned base, providing a measure of confidence in the base call (see Data Quality Metrics for details).
The chromatogram shown by most trace viewers is a processed version; raw data from the sequencer is manipulated by analysis software to facilitate base calling (see How Bases Are Assigned for more details). The start of the processed trace, assigned position 1, is the software's best guess of the first peak. Let's take a look at common features within a chromatogram and how to interpret them. We'll mainly focus on data from high-quality reactions.
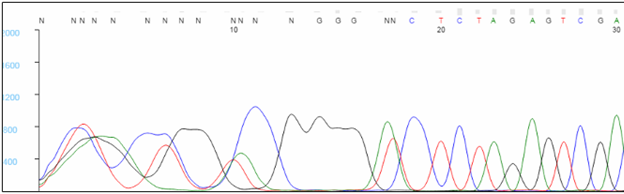
Start of the Trace
The first 20 to 40 bases are typically not well resolved. Very short sequencing products do not migrate in a predictable manner during capillary electrophoresis, and the analysis software has difficulty assigning bases within this region, causing Ns to appear in the sequence. To avoid having critical data fall in this region, we recommend designing primers that bind at least 60 bp, preferably 100 bp, away from key bases. Note that the sequence of the primer will not be seen in the results, as bases within the primer are not labeled during the extension reaction.
Middle of the Trace
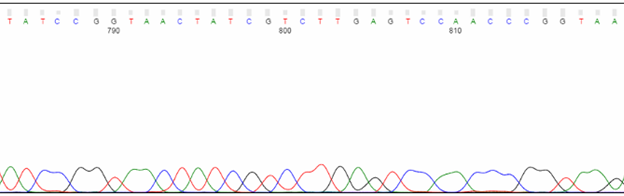
Most sequencing protocols are optimized to provide the best peak resolution between roughly 100 and 500 bases. In this range, peaks should be sharp and well-spaced, and the base calling is most reliable.
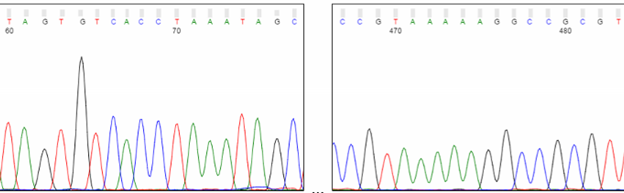
End of the Trace
Toward the end of the trace, expect peaks to be less defined and lower in intensity. The base calling will also be less reliable. Due to the nature of in vitro polymerization, larger sequencing products are generated less efficiently than their shorter counterparts. Thus, the larger products are fewer in number and produce a weaker signal. Also, with any electrophoresis method, it becomes increasingly difficult to resolve a single-base difference as DNA fragments become larger. For example, the difference in molecular weight between 100 bp and 101 bp is 1%, whereas it's just 0.1% between 1,000 bp and 1,001 bp.
Terminal A Peaks (for PCR products)
The Taq polymerase used in the sequencing reaction will add a non-template adenine upon reaching the end of a linear template. This activity causes an A peak to appear at the end of the trace, followed by an abrupt drop in signal. For PCR products, Azenta Life Sciences uses an analysis protocol that attempts to identify terminal A peaks and stops base calling beyond this point.
Distortion at the End of PCR Products
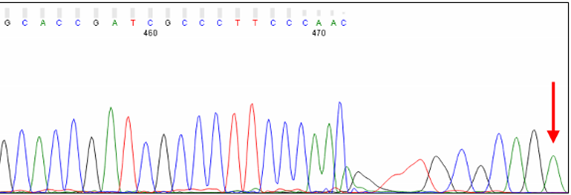
Short PCR products can show distorted peaks at the very end of the trace. The cause is likely template or unlabeled sequencing product migrating in the capillary. The excess of DNA at this position may disrupt the migration of labeled sequencing products, leading to a loss of resolution.
Dye Blobs (around position 80)
Broad C and T peaks may be observed around position 80. Known as “dye blobs,” these peaks represent aggregates of unincorporated dye terminators. Although most cleanup protocols are effective at removing leftover nucleotides after completion of the sequencing reaction, no method is 100% effective. Dye blobs are more frequently observed in inefficient sequencing reactions, which have a higher fraction of unincorporated nucleotides and a low signal-to-noise ratio. Please note that the sequence within this region can often be determined by manual inspection of the chromatogram, even if the analysis software is unable to assign bases (i.e., Ns appear in the sequence). If you need to sequence a key base, such as an SNP, we recommend using primers that bind at least 100 bp away from the key base to avoid it falling within the dye blob region.
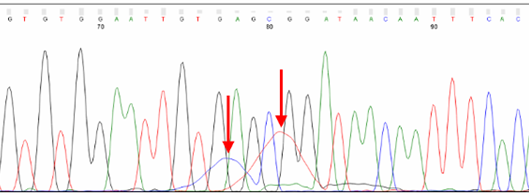
Dye blobs (arrows) represent unincorporated dye terminators that co-migrate with fragments roughly 80 nt in size. Depending on their intensity, they can interfere with automatic base calling.
Artifacts from Rolling Circle Amplification
For direct sequencing of bacterial and phage samples, Azenta Life Sciences uses an in vitro rolling circle amplification (RCA) reaction to bulk up the plasmid or phage DNA. This process generates a high-molecular-weight product, containing many concatemers of the plasmid or phage DNA, which is suitable for sequencing. During capillary electrophoresis, RCA products may be injected into the capillary along with the labeled sequencing products. These large products can "clog" the capillary and cause artifacts in the chromatogram, usually seen after 600 nucleotides. Peaks may be compressed or stretched, and a multi-color spike may be present. Base calling around these artifacts is not reliable.
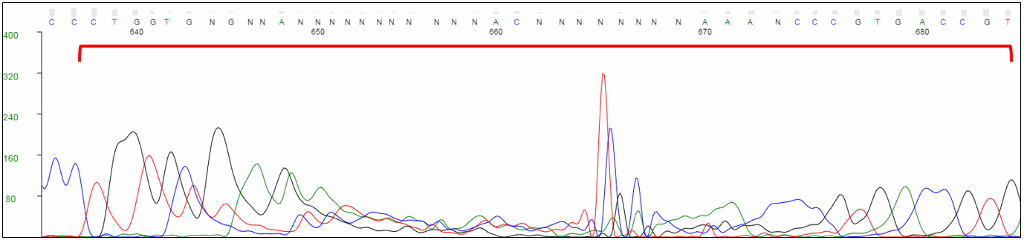
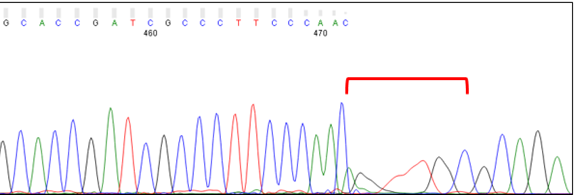
Unlabeled RCA products can cause distortions in the chromatogram, typically towards the end of the trace.
How Bases Are Assigned
Once the raw data is collected by the sequencer, it's processed and analyzed by base-calling software. The four dyes used in Sanger sequencing have slightly different mobility properties due, in part, to their unequal molecular weights. Therefore, the relative position of the peaks must be slightly adjusted to compensate for these differences (see figure below). After this correction, the algorithm identifies peaks and assigns bases.
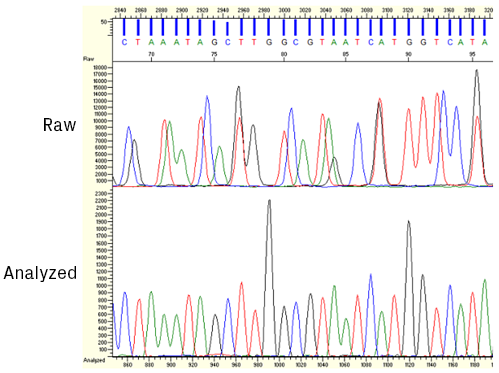
Screenshot from KB™ Analysis software showing sequencing data before and after applying mobility shift corrections.
Data Quality Metrics
Several convenient statistics are available in each chromatogram, describing data quality at the level of individual bases or the entire trace. These values are useful when evaluating the reliability of the output sequence.
Quality Value (QV)
Each assigned base is accompanied by a quality value (QV), which is logarithmically related to the base-calling error:
QV = -10 × log (error probability)
For example, an assigned base with QV = 20 has an error probability of 0.01, or a 1% chance of being incorrectly called. The QV ultimately depends on the shape and signal-to-noise ratio of the peak, and it provides the most objective metric to evaluate the confidence of the base call. Please note these values are closely related to Phred quality scores1,2. By default, Azenta Life Sciences assigns an A, T, G or C when QV ≥ 10 and an N when QV < 10. QVs are embedded in the ab1 file and can be seen in chromatogram viewing software (see example below). High-quality peaks generally have a QV of 20 or higher.
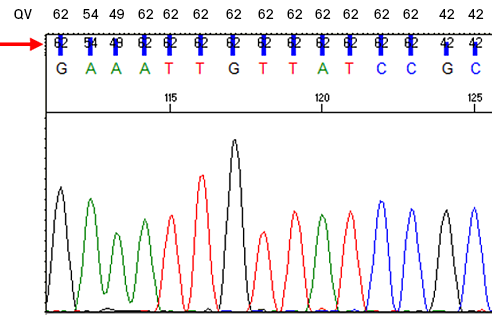
Closeup of a chromatogram with quality values (QV) as numbers and vertical bars (arrow). The numerical values are reproduced above the trace for clarity.
Quality Score (QS)
The quality score (QS) is the average QV for all peaks in the trace with an assigned base. It serves as a metric for overall sequence quality. Generally speaking, traces with QS ≥ 40 have good quality; however, it's advisable to scan the chromatogram to confirm this. Use caution for traces with QS values around 30. Those with QS < 20 are likely to have a weak signal and/or high noise. Many factors can lead to a poor sequencing reaction, including suboptimal template quantity or quality, a heterogeneous mixture of templates, and structural features that interfere with the extension reaction (e.g., GC-rich or repetitive regions).
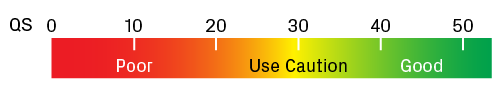
Scale for quality scores (QS). Traces with QS values greater than 40 usually contain high-quality data. Lower values require extra scrutiny of the chromatogram.
Continuous Read Length (CRL)
The analysis software evaluates the running 20-base average of QV scores. The longest uninterrupted stretch of bases with a running QV average of 20 or higher is known as the continuous read length (CRL). For plasmid samples and PCR products longer than 500 bp, CRL values above 500 are associated with high-quality data.
Intensity Values
For high-quality data, the sequencing reaction must produce enough labeled product to generate a strong signal in the sequencer. Average signal intensity is thus an indicator of the robustness of the reaction. At the bottom of the Azenta online trace viewer, you can see the average signal intensity of the trace (see example below). This information is also embedded in the trace file and can be retrieved from third-party chromatogram viewing software.
| Sequence File |
Example-T7.seq |
| Average Signal Intensity |
G |
A |
T |
C |
| 2187 |
2111 |
2720 |
2580 |
Intensity values are reported in relative fluorescence units. Please note that most trace viewers will rescale the intensity axis (y-axis) to optimize visualization of the peaks, so it's important to pay attention to the actual values shown. Robust sequencing reactions typically have average intensities greater than 1,000. Values less than 100 usually indicate noisy traces with low-quality peaks. Very high intensities (above 10,000) can also be problematic, as the sensor in the sequencer becomes oversaturated, causing signal to spill over into other channels—a phenomenon known as spectral pull-up.
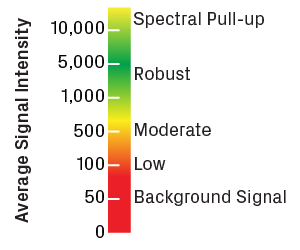
Scale for trace intensity values, measured in relative fluorescence units. Low intensity will result in a high degree of noise. Very high values will cause spectral pull-up, leading to artificial peaks in the trace.
Key Takeaways
- Although many automated tools are available for analyzing Sanger data, there is no substitute for visual inspection of the chromatogram
- The highest quality data, and thus the most accurate base calling, will typically occur between positions 100 and 500 in the trace
- Using quality metrics enables you to objectively evaluate the data and determine the reliability of the output sequence
Conclusion
Sanger sequencing remains a fundamental part of molecular biology workflows. As the gold standard method of sequencing, it provides high-quality data in as fast as a few hours. Understanding how to interpret chromatograms accurately will enable you to extract the most value from your Sanger sequencing data.
Want to learn more tips and tricks from the Sanger experts? Download our five-part series Sanger Quick Tips. It covers how to prepare PCR products for sequencing and troubleshoot common issues.
Download Sanger Quick Tips
References
1. Ewing, B., Hillier, L., Wendl, M. C. & Green, P. Base-Calling of Automated Sequencer Traces Using Phred. I. Accuracy Assessment. Genome Res. 8, 175–185 (1998).
2. Ewing, B. & Green, P. Base-Calling of Automated Sequencer Traces Using Phred. II. Error Probabilities. Genome Res. 8, 186–194 (1998).